
When you’re in charge of a project for your freelance gig or full-time job, you use various diagrams to understand project planning or progress. Gantt and PERT charts are the most common diagrams for any project that you can think of.
In this article, we will discuss the differences between Gantt chart and PERT chart in detail. Moreover, you’ll also know when to use them in project cycles, what are the benefits, and which one is the best.
What Is a Gantt Chart?
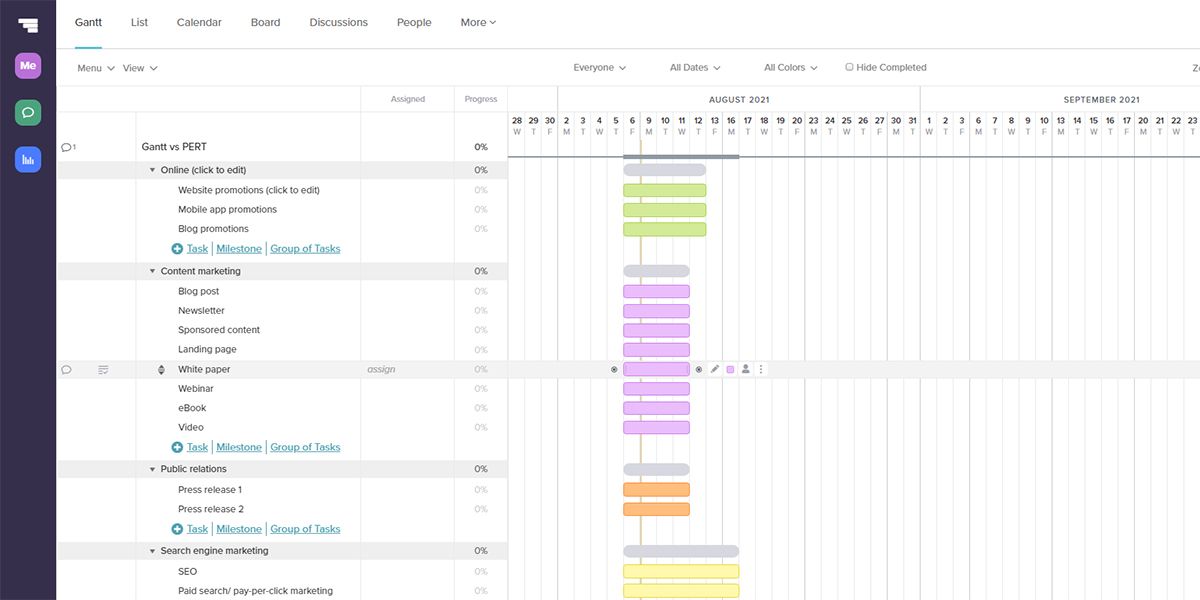
Gantt chart visualize the project progress in a timeline format from beginning to completion. A standard Gantt chart consists of the following sections:
- The left-side spreadsheet shows the tasks of a project.
- The right-side timeline shows the progress of the tasks and any dependencies.
Bar graphs are the key components of the timeline section of a Gantt Chart. You’ll see that these bar charts appear on the Gantt chart timeline chronologically.
What Is a PERT Chart?
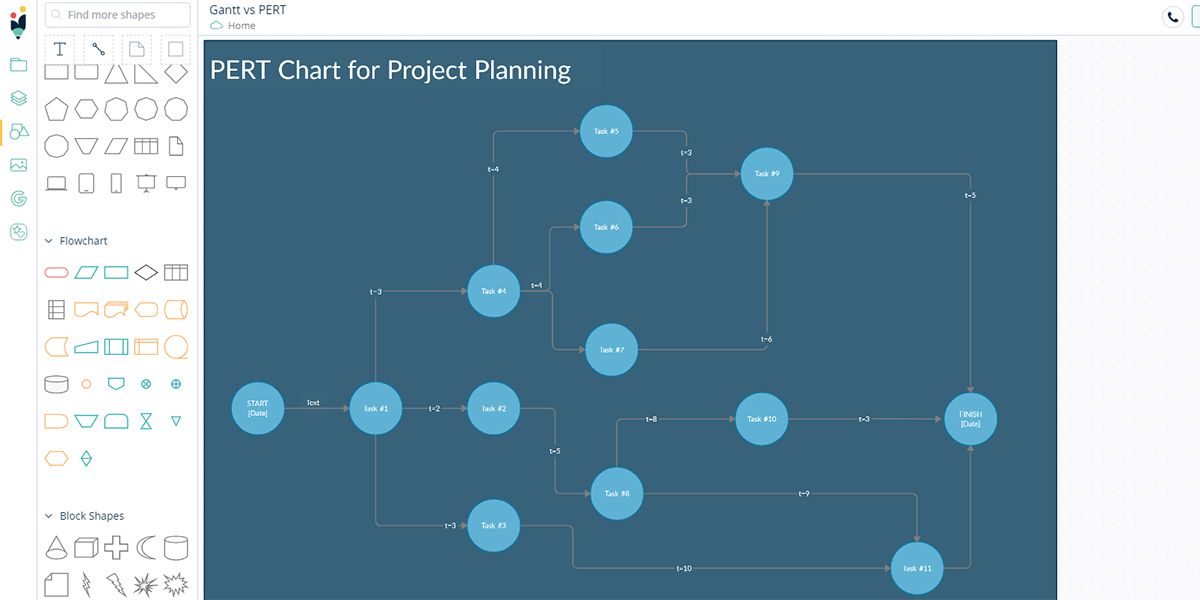
PERT chart is the contraction for Program Evaluation Review Technique chart. A flow chart-like graphical representation on a 2-D plane shows all the tasks from start to end.
The key components of a PERT chart are nodes, arrows, milestones, critical path, etc. This tool gives a holistic view of tasks, dependencies, time estimation, and terms.
PERT chart mostly resembles a network diagram, where tasks are the nodes (rectangular or circular elements), and arrows define their relationship. As a result, most project managers consider this tool as a project roadmap.
When to Use Gantt Chart

You can use a Gantt chart when you want to get a clear picture of an ongoing project. Project managers use Gantt chart to know the following:
- Visualize project start and end dates for proficient project management activities.
- Create and assign tasks to the project resources and manage milestones.
- Enable the project team to view project progress with complete transparency.
- Keep deadlines in mind for tasks, milestones, and the overall project.
- Pinpoint bottlenecks on the path of project progress and mitigate them without impacting the project deadline.
- Professionally present project reports to the client.
When to Use PERT Chart

PERT chart helps a project manager to plan and execute a project seamlessly. Simply put this way, one tool for all of your project management needs. You may use PERT chart when you’re looking for the following insights:
- Define tasks, dependencies, resources, and workflow at the project planning phase.
- Know a realistic deadline for the entire project and commit to the client accordingly.
- Find out accurate estimations of the amount of work and resources needed to complete the project.
- Discover the critical path of the project. It is the chain of tasks that need the most time before completion. Tweak this critical path to reduce time consumption.
- Plan more than one task in a given time and figure out how to prioritize resources to increase project productivity.
- Ensure task completion timing by enforcing strict terms so that resources stick to the tasks’ workflow.
- Convert complex projects to simpler ones through a visual project roadmap.
Pros of Gantt Chart
Gantt's chart have few unique advantages over other project management tools or charts. The benefits are:
- It is a global standard for managing projects once the project has begun its journey.
- It’s comparatively easier to understand.
- You’ll know whether the project is on track by overlapping the real-time project Gantt chart with a pre-project Gantt chart.
- Since a Gantt chart uses bar graphs, it finds wide acceptance among clients for project reporting.
- Gantt chart show you real-time movements of the project workflow.
Pros of PERT Chart

PERT chart contribute greatly during project planning. The advantages of PERT chart over other tools are as follows:
- This tool helps you estimate accurate working hours for the project. Thus, you can bid accordingly to the client.
- You can also visualize the overall amount of tasks involved in a project before it starts.
- PERT chart effortlessly show the task dependencies. Knowing this in advance, you’ll be able to plan the project strategically without increasing the resource budget.
- The tool empowers you to forecast risks even before the onset of the project.
- The graphical representation of the whole project workflow makes it easy for the client and project team members to understand what to expect.
- The critical path discovery feature helps you change your tactics if there are any issues that impact project delivery.
- Fast-tracking of project tasks enables your teams to hand off project deliverables faster.
The Key Difference Between Gantt and PERT Chart
In most projects, the manager could use PERT and Gantt charts together to maximize project performance. However, the fundamental differences between Gantt and PERT charts are as follows:
1. Visualization
Gantt chart rely on spreadsheets and bar graphs. Hence, you require dedicated apps to create Gantt chart.
PERT chart are free-form diagrams. You can create PERT chart in any graphic designing or digital drawing platform.
2. Project Planning
A Gantt chart can help you manage a project after the onset of the project. It’s unable to assist you during project planning.
On the other hand, the PERT chart is a specialized tool for project planning, task identification, dependency discovery, and time estimation.
3. Creation and Interpretation
In comparison to the PERT chart, it’s easier to comprehend the Gantt chart. However, creating a Gantt chart is comparatively complex than designing a PERT chart.
So, which one is suitable for your project? It pretty much depends on the project that you’ll be handling. For easy and small projects, stick to the Gantt chart. But, if the project is large and complex, you’ll need both Gantt and PERT charts.
Online Apps to Create Gantt & PERT Charts
Nowadays, there are dedicated apps that offer ready-to-use Gantt chart. Try out any of the following online apps:
1. TeamGantt
The tool is free for up to three team members. It offers basic project management features, like Gantt chart, free of cost. The drag-and-drop Gantt chart maker makes the tool truly intuitive. You can easily track available resources from the app and assign tasks to them.
You can also create a Gantt chart and collaborate in real-time through file attachments, email reminders, and task conversations.
2. ClickUp
ClickUp is an online project management app that offers Gantt chart as one of its features. The free plan will get you 100 MB of cloud storage and unlimited projects.
The app automatically creates a Gantt chart as a part of reporting. All you need to do is populate tasks, record task time, and draw the task dependencies.
3. Creately
It’s another trending free online diagram maker that offers professional templates to create PERT chart. The free plan comes with three documents and one folder with limited features.
Creately is also a drag-and-drop PERT chart editor. However, it’s easier to use templates that are highly objective and suitable for most projects.
Visualization of Project Insights Made Easy
After knowing the differences between Gantt and PERT charts, you can effectively and appropriately use any of these, depending on the project cycle. Moreover, you can effortlessly create professional-looking project management charts (Gantt or PERT) on your own using online or desktop apps.


0 Comments